About me
As a Research Scientist at the Dana-Farber Cancer Institute (DFCI), I leverage statistics, computer science, and bioinformatics to advance cancer immunology and therapeutics. My expertise lies in developing computational tools and integrating large-scale datasets to decode the complexities of cancer treatment. My current work involves the genomic and transcriptomic profiling of breast cancer patients from unique clinical trials. My active investigations include analyzing how treatment sequencing affects responses to preoperative nab-paclitaxel plus pembrolizumab in early-stage HR+ breast cancer, as well as utilizing multi-temporal molecular profiling to uncover tumor-intrinsic mediators of therapy resistance. Selected software are listed in the following contents.
Web Apps
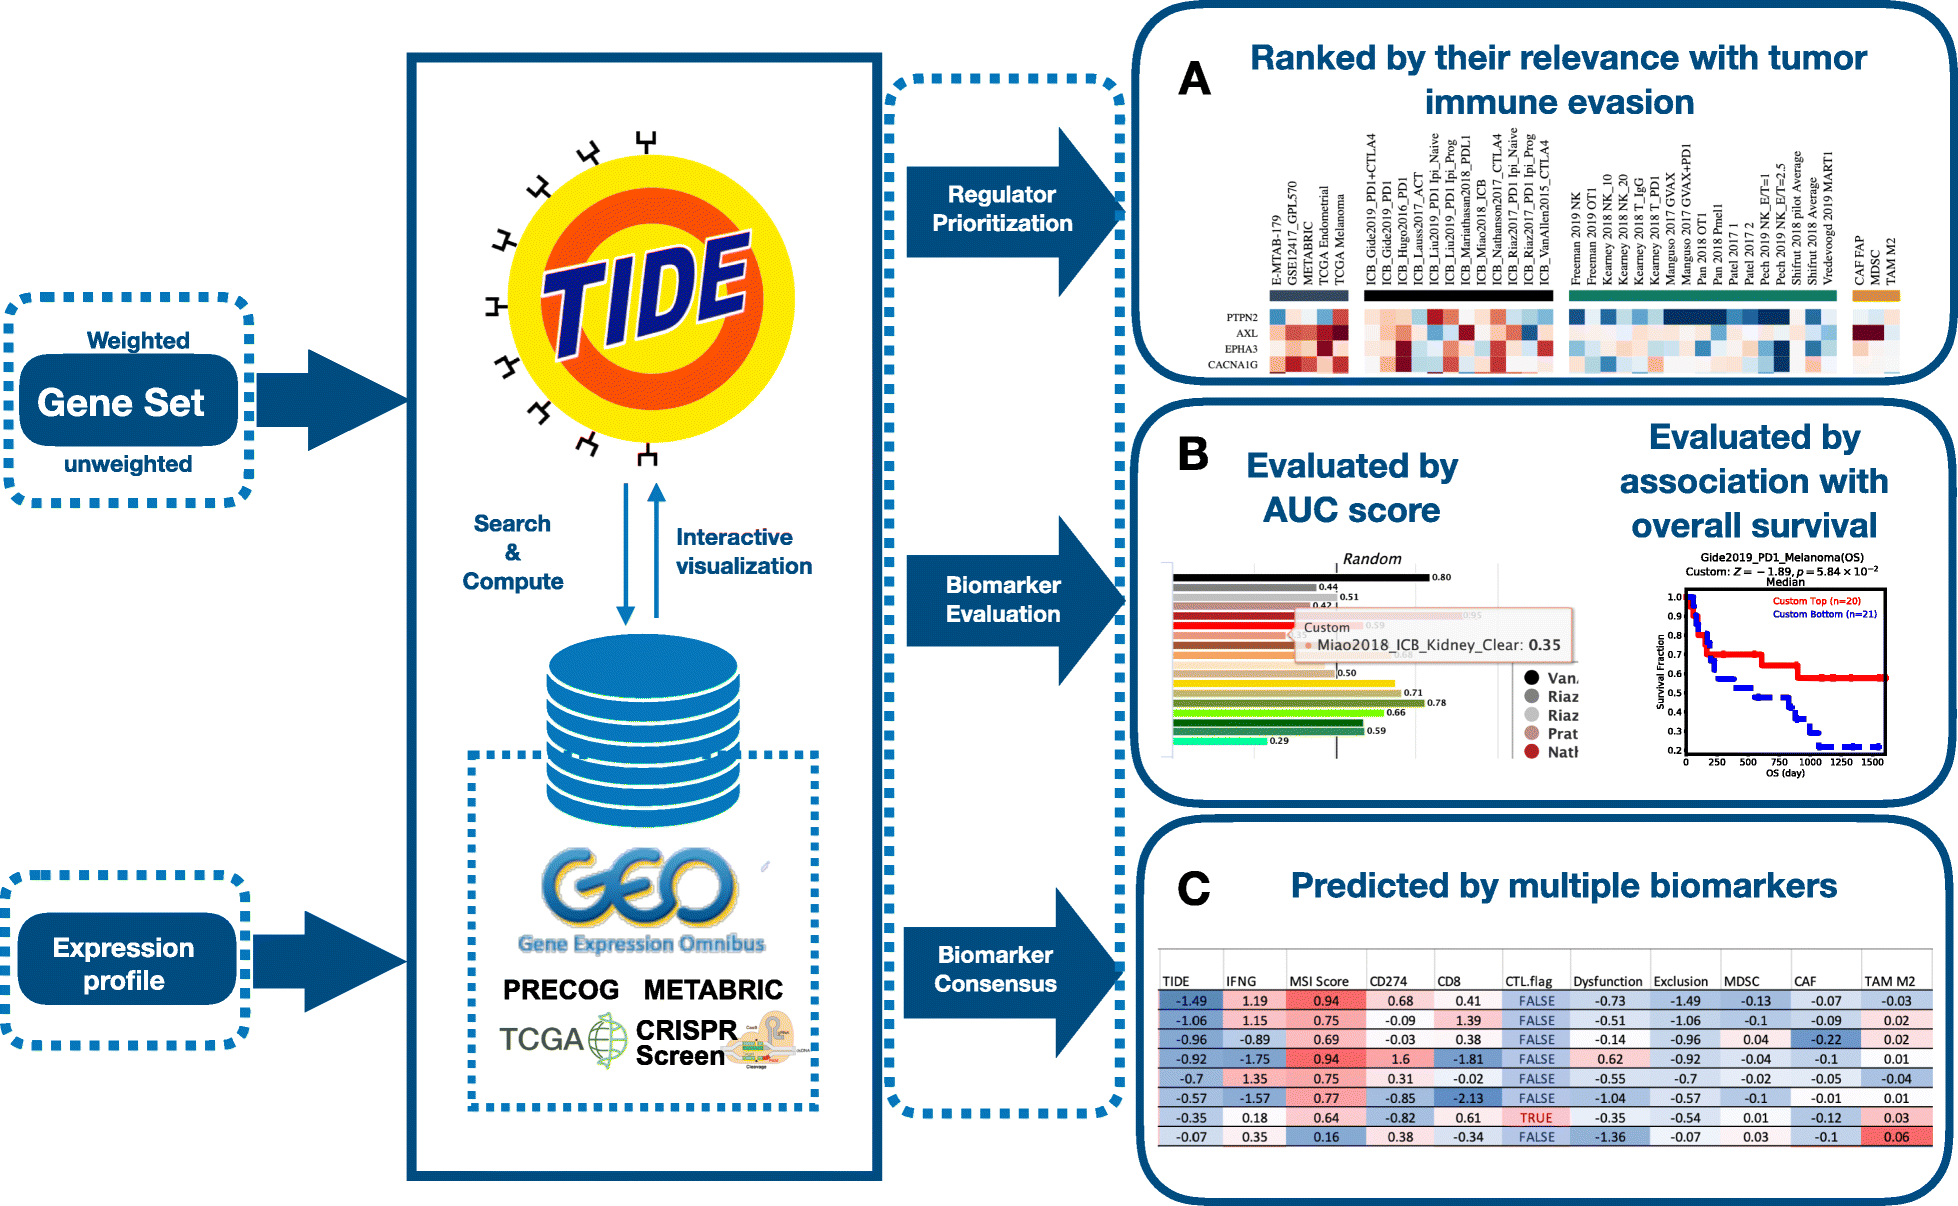
TIDE: large-scale public data reuse to model immunotherapy response and resistance
View Website doi: 10.1186/s13073-020-0721-zWe integrated large-scale omics data and biomarkers on published ICB trials, non-immunotherapy tumor profiles, and CRISPR screens on a web platform TIDE. We processed the omics data for over 33K samples in 188 tumor cohorts from public databases, 998 tumors from 12 ICB clinical studies, and eight CRISPR screens that identified gene modulators of the anticancer immune response. Integrating these data on the TIDE web platform with three interactive analysis modules, we demonstrate the utility of public data reuse in hypothesis generation, biomarker optimization, and patient stratification.
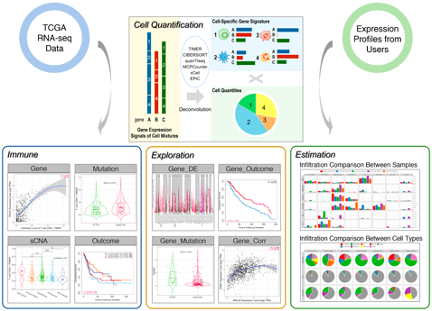
TIMER2.0: Analysis of tumor-infiltrating immune cells
View Website doi: 10.1093/nar/gkaa407TIMER2.0 provides robust estimation of immune infiltration levels for The Cancer Genome Atlas (TCGA) or user-provided tumor profiles using six state-of-the-art algorithms. TIMER2.0 provides four modules for investigating the associations between immune infiltrates and genetic or clinical features, and four modules for exploring cancer-related associations in the TCGA cohorts. Each module can generate a functional heatmap table, enabling the user to easily identify significant associations in multiple cancer types simultaneously. Overall, the TIMER2.0 web server provides comprehensive analysis and visualization functions of tumor infiltrating immune cells.
Data Visualization
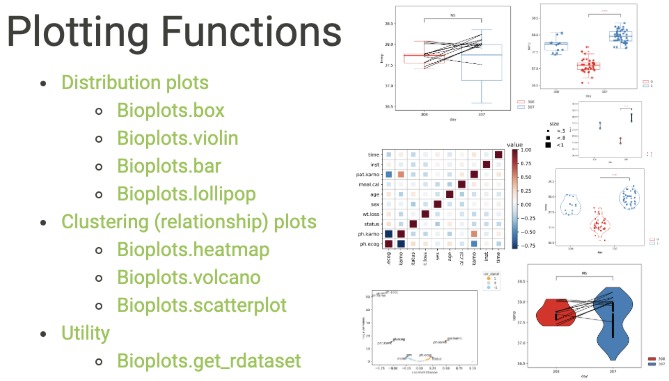
Bioplots: The visualization package with statistics annotation.


Bioplots is a Python data visualization package based on matplotlib. It provides graphics with statistical annotations.
Data Collection
TCGAdnloader: Downloading data from the TCGA on a managable data structure.
GithubThis package can download TCGA public available molecular profiles from both firebrowse and GDC Data portal. Data will be stored based on the molecular type.